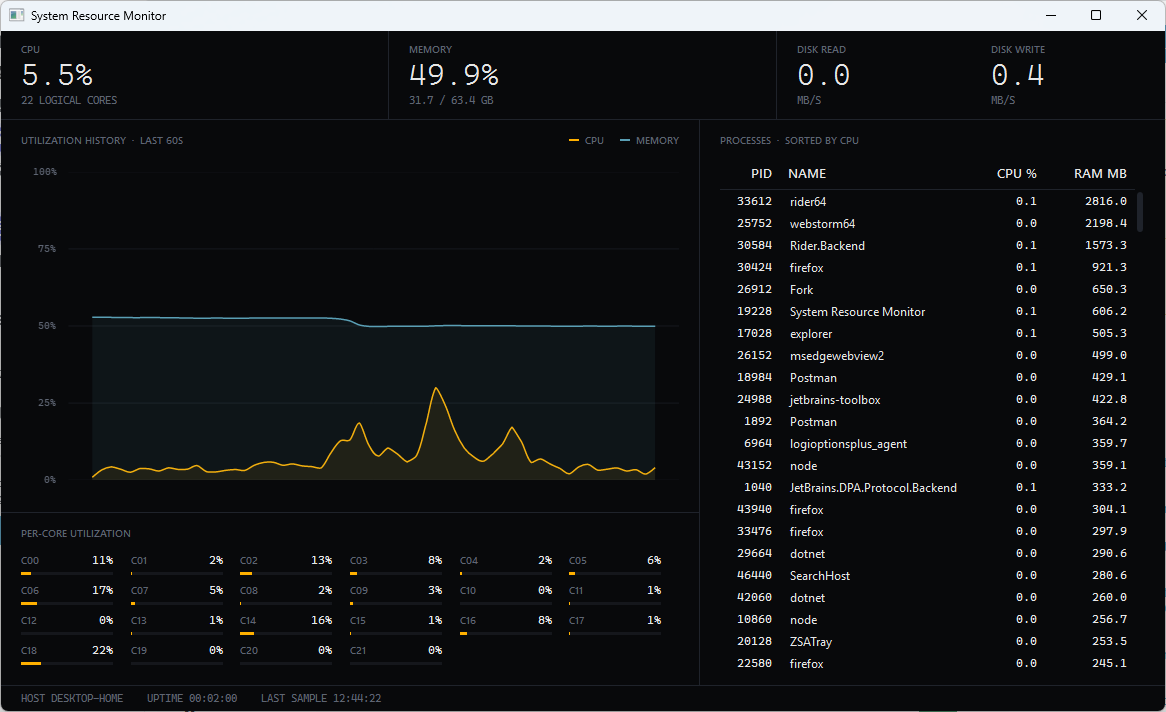
A Windows desktop dashboard for live CPU, memory, disk, and process metrics, built in WPF on .NET 9 using MVVM (Model-View-ViewModel) and Dependency Injection.
Features
- Overall and per-core CPU utilization for every logical processor
- Used / available / total physical memory with derived percentage
- Disk read and write throughput in MB/s
- 60-second rolling history chart for CPU and memory
- Sortable process list with per-PID CPU% and memory usage
- 1 Hz sampling that never blocks the UI thread
Architecture
The app is a single window composed of feature views that each bind to their own ViewModel.
A ShellViewModel aggregates the feature ViewModels (Process List, CPU %, Memory %, etc), owns the sampling loop, and is the only DataContext the main window ever sees.
Each one-second tick crosses a thread boundary: sampling runs on the thread pool, results are applied to the bound ViewModels on the UI thread, and XAML data binding takes care of the redraw.
flowchart LR
    subgraph pool [Thread Pool]
        services[Services<br/>PerfCounter/WMI/Process]
    end

    subgraph ui [UI Thread]
        shell[ShellViewModel]
        vms[Feature ViewModels]
        views[Views]
    end

    shell -->|"Task.Run Sample()"| services
    services -->|"sampling data"| shell
    shell -->|"ApplySample/ApplySnapshot"| vms
    vms -->|"PropertyChanged"| views